Slap a piece of information on a graphic, and you’ve got an infographic, right? While that might be the general idea, it does require a little bit more work — but it’s definitely worth it. And here are some numbers to prove it:
-
- Infographics can improve web traffic by 12 percent
- 42 percent of marketers say infographics and other original graphics are the most engaging visuals
- Infographics are 30 times more likely to be read than a purely text article
- Infographics are shared three times more than any other visual element on social media
Want to start enjoying some of these benefits but aren’t sure where to start? Luckily, you don’t need a design degree to create an engaging infographic. You just need the right data and tools.
Narrow down your information
Before you can even begin to think about the design aspect of your infographic, you need to first figure out what it will be about. Maybe you have data from a customer survey or did some research about your industry. No matter where the information comes from, it needs fine tuning before it’s infographic ready.
Start by deciding on a focus for your info. For example, you could create one on how donations are used in your nonprofit. Or, take a topic that’s of interest to your audience — like trends or data related to your industry — and collect information around that for a graphic.
If you have a wide range of information, break it down into separate infographics. Don’t try to cram everything into one. It helps to type out each piece of information and then categorize them to see what works together.
Decide on a format
How do you want to display your information? Do you want large percentages, creative images, or maybe a mix? There are several different types of infographics, so pick the one that best fits your information. Here are a few of the most popular types of templates:
-
- Timeline: Show the history or progression of something — like how your organization or nonprofit got to where it is today
-
- Statistical: Good for displaying survey data or research
-
- Informational: Not as number heavy (although people do love some good stats) but good for explaining a topic or as a “how to”
-
- Comparison: Give information on two or more options, like your company vs. the other guy
- Photo: Get creative with images and other graphics to share an interesting number, like using an image of a baseball as a pie chart to share a sports stat
You don’t have to stick to just one type of format, but it helps to keep the design consistent. For example, you wouldn’t want to have a large timeline with a random comparison chart thrown in.
It helps to visualize how you want to present the data before you jump into it, so grab a pen and paper to map out the infographic. You can get the creative juices flowing by checking out some of these infographic ideas.
Choose your design tool
Your level of design expertise (or lack thereof) will help determine which design program works best for your project. If you have the skills and software, using Adobe InDesign will give you a blank canvas to build your infographic. But if you’re looking for something a little easier to navigate, there several free online options you can turn to.
Canva

One of those free tools, Canva provides templates and images to design a variety of visuals, including social media images, documents, eBook covers, marketing materials, and infographics. When you start designing an infographic on the site, it will give you a choice of types — like timeline, business, charity, process, and education template — or you can decide that later.
You can choose from different pre-made infographic templates, or start from scratch. There are several free templates and images available on the site, and you can also upload your own images to use in the design.
Piktochart
 Another online option is Piktochart, which allows you to design infographics, presentations, and printables. Its chart feature lets you plug in your numbers and choose from different types of charts and graphs, like dot, area, line, bar, pie, and donut.
They make it easy to see which infographic templates are free and which ones will require a Pro account. To download a high-resolution version or PDF, you’ll have to pay to upgrade your account. But, the free medium resolution works just fine for online use.
If you want to choose from a large library of public templates — or just make your own — you’ll find them on Easel.ly. You can search by keyword or choose from categories like marketing, business, holiday, social media, and timeline. Or if you’d rather hand over the task, Easel.ly offers a paid design services where they’ll create an infographic for you within 24 hours.
Stick to a theme
Like with any good design, your infographic needs to have some consistency. Pick a color scheme that matches the mood of the infographic — a fun topic could be bright colors, whereas something more serious could be in black and white.
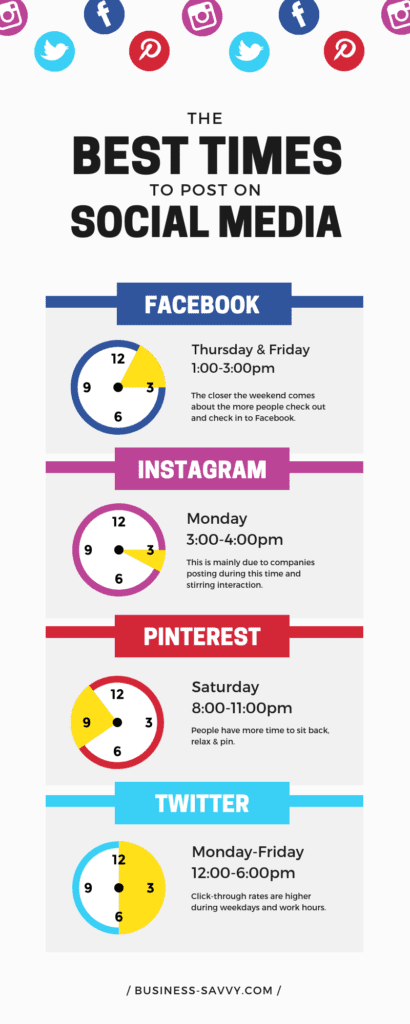
You’ll also want to stick to a uniform look when it comes to the types of images you’re using: Don’t mix a stick figure with an actual photo. Take this infographic for example:
 (Source)
They stuck with two colors and similar image designs so the graphic has a clean, fluid look. You can find stock images like these through sites like Creative Commons or on the design tool.
Give credit where it’s due
Whether you gathered the information from surveys, CRM data, research, or a third-party source, let your audience know where it came from. Depending on where the information came from, you have a few options on how to cite your source.
If it all came from one place — like an in-house survey, trusted media partner, or a university — you can put one credit at the end. However, if each piece of information came from a different place, you’ll need to show viewers where you found them. You can do that by putting a subscript next to each graphic that corresponds to the citation at the bottom of the infographic.
Sharing your sources not only gives your infographic credibility, but it can also be used as a marketing tool. Share the infographic with any sources you cited, thank them for having such great info, and encourage them to share it with their audience.
And don’t forget to promote your infographic on your website, social media pages, and through email. After you do all of that work, you want to make sure you’re actually driving traffic and engagement with it!
Lauren Dowdle is an award-winning writer based in Nashville, Tenn. Her decade-long writing career has covered everything from landscaping to marketing.

